Connexus Gender and Ethnicity Pay Gap Report 2025-2026
Foreword
At Connexus, our ambition is to provide an inclusive and supportive workplace where all colleagues feel empowered to develop, progress and contribute to the communities we serve in providing homes our customers can build their lives in.
Publishing our Gender and Ethnicity Pay Gap reports each year enables us to understand the structural factors that influence pay distribution across our organisation. This insight is central to shaping the targeted actions within our People Strategy and new Equality, Diversity & Inclusion (EDI) Strategy, approved by the Board in December 2025 following engagement with both colleague and customer forums.
This year’s analysis shows that our gender gap has widened compared with last year’s reporting period, whilst the ethnicity pay gap illustrates a divergent trend between the mean and median data. These gaps reflect workforce distribution patterns, with men, women and ethnically diverse colleagues concentrated in different types of roles. This is a significant driver of the pay gaps, both positive and negative, and it is important to note that this does not indicate unequal pay for equal work, but rather differences in representation across job families and seniority levels.
While we recognise that we still have progress to make, we now have the structures and strategies in place to enable and embed meaningful and sustainable change. This includes the establishment of colleague network groups to better understand lived experiences, and the development of a diversity awareness and education programme to accelerate progress. We are also beginning to see positive movement in traditionally gendered roles, including increasing success in attracting and recruiting women into skilled trades apprenticeship roles, helping to challenge and break longstanding societal stereotypes.
We remain fully committed to addressing these disparities, narrowing the gaps, and continuing to build an inclusive organisation where everyone has the opportunity to thrive.
Kate Smith, Chief Executive
1. What Pay Gap reporting measures
The gender pay gap is the calculated difference between the average (mean and median) earnings of males and females across the workforce as of 5 April 2025, the snapshot date. It shows the difference in the average hourly rate of pay between women and men and is distinct from equal pay. This approach enables transparency about gender pay differences and enables positive actions. Similarly, Connexus voluntarily reports ethnicity pay gaps using mean and median comparisons between white and ethnically diverse colleagues.
In line with the Equality Act 2010 (Gender Pay Gap Information Regulations 2017), Connexus reports:
- Mean and median gender pay gap
- Mean and median gender bonus gap
- Proportion of male and female colleagues receiving a bonus
- Distribution of male and female colleagues across four pay quartiles
The mean pay gap is the percentage difference in the mean average pay between all male and female employees in the organisation. We calculate the mean by summing up all the salaries and dividing by the number of employees.
The median pay gap is the percentage difference in the median average pay between all male and female employees within the organisation. We calculate the median by ordering all employees pay from highest to lowest and finding the middle.
Pay quartiles shows the percentage of males and females in each pay quartile. We develop these by ordering all employees pay from highest to lowest and splitting them into four equal groups.
2. Workforce gender ratio
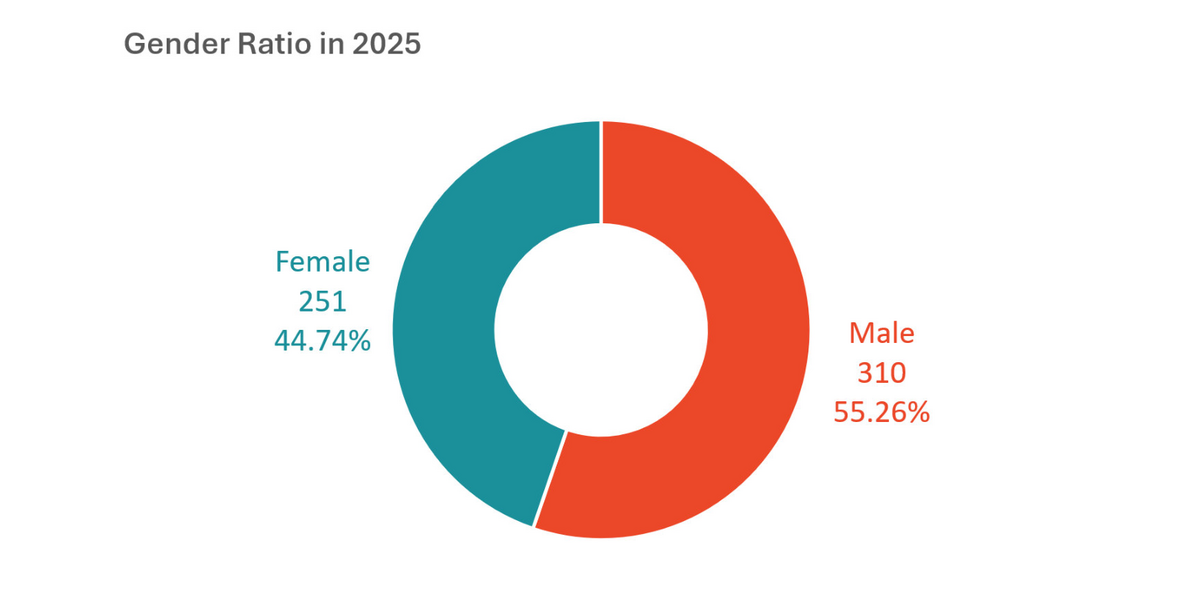
Connexus employed 561 colleagues on the payroll on 5th April 2025, representing a 4.5% increase in colleagues from 5 April 2024 to 5 April 2025.
Of our 561 colleagues, 55.3% (310) were male and 44.7% (251) were female, or a difference of 10.5%. This compares to a difference of 12.5% in April 2024 and 11.2% in April 2023, highlighting a slight improvement in the workforce gender balance compared to the previous two years.
3. Gender Pay Gap results
3.1 Mean & median gender pay gap
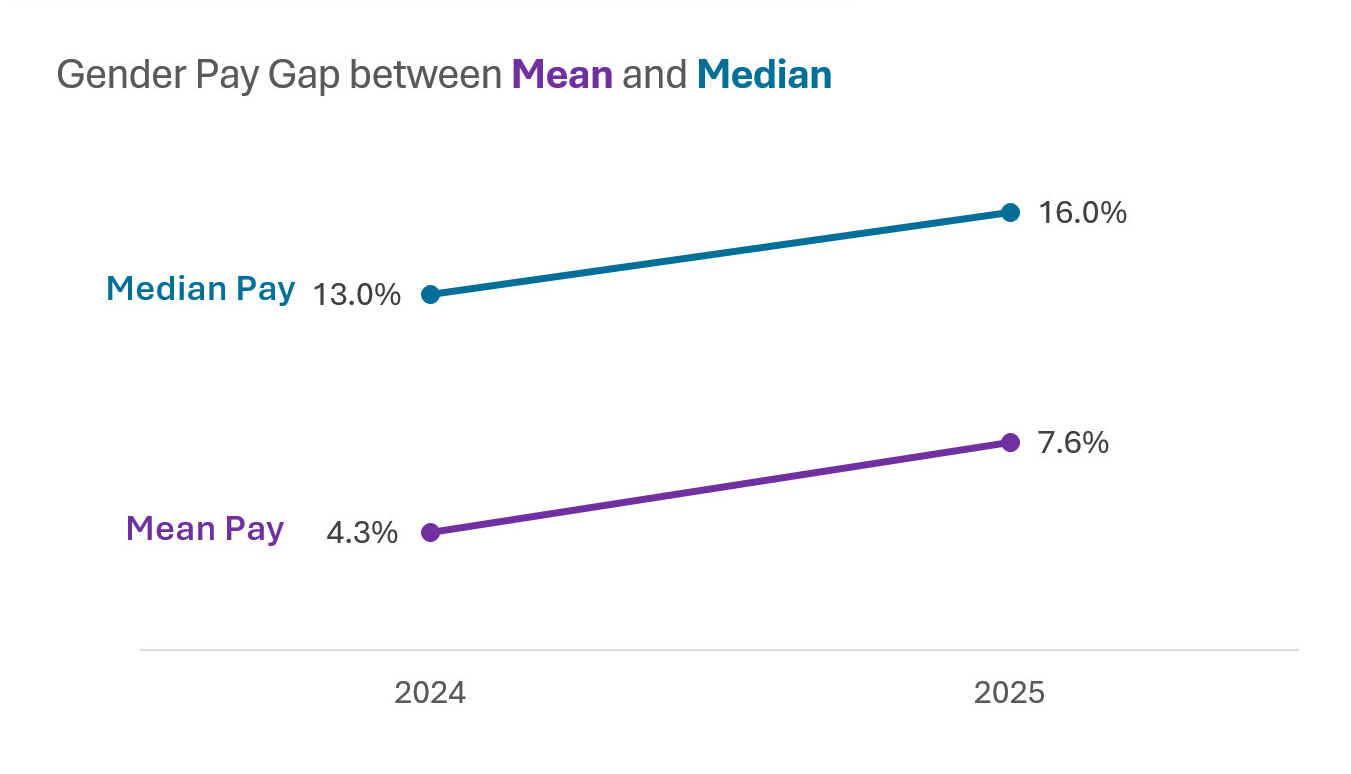
Table A illustrates the year-on-year comparison for the Mean and Median Pay Gap.
| Snapshot Year | Mean GPG | Median GPG |
|---|---|---|
2023–2024 | 4.3% | 13.0% |
2024–2025 | 7.6% | 16.0% |
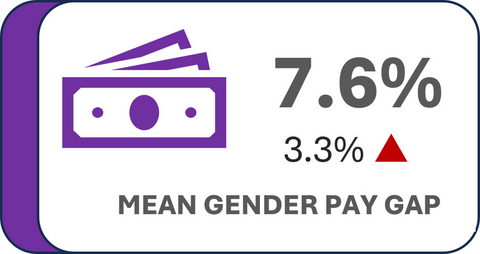 As the above table illustrates, the mean gender pay gap increased from 4.3% to 7.6% in the twelve-month period from 5 April 2024 to 5 April 2025, representing an increase of 3.3%, driven largely by higher male representation in ‘upper middle’ quartile roles.
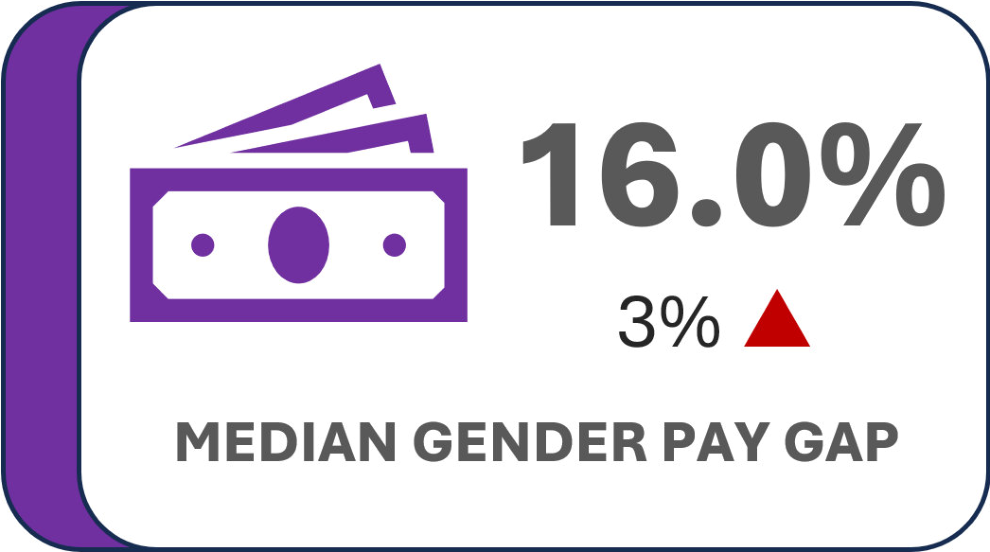 The median gender pay gap also increased from 13.0% to 16.0%, representing an increase of 3% over the twelve-month period, reflecting the clustering of women in lower quartiles as set out in 3.2, ‘Gender Pay Quartiles’ below.
3.2 Gender Pay quartiles
Table B below sets out the pay range and gender representation of colleagues across the four quartiles.
| Quartile | Pay Range (£) | % Male | % Female |
|---|---|---|---|
Lower
| 0.07–13.89
| 44.8
| 55.2
|
Lower Middle
| 13.89–18.08
| 41.0
| 59.0
|
Upper Middle
| 18.08–21.26
| 71.6
| 28.4
|
Upper
| 21.26–116.22
| 66.9
| 33.1
|
Table B
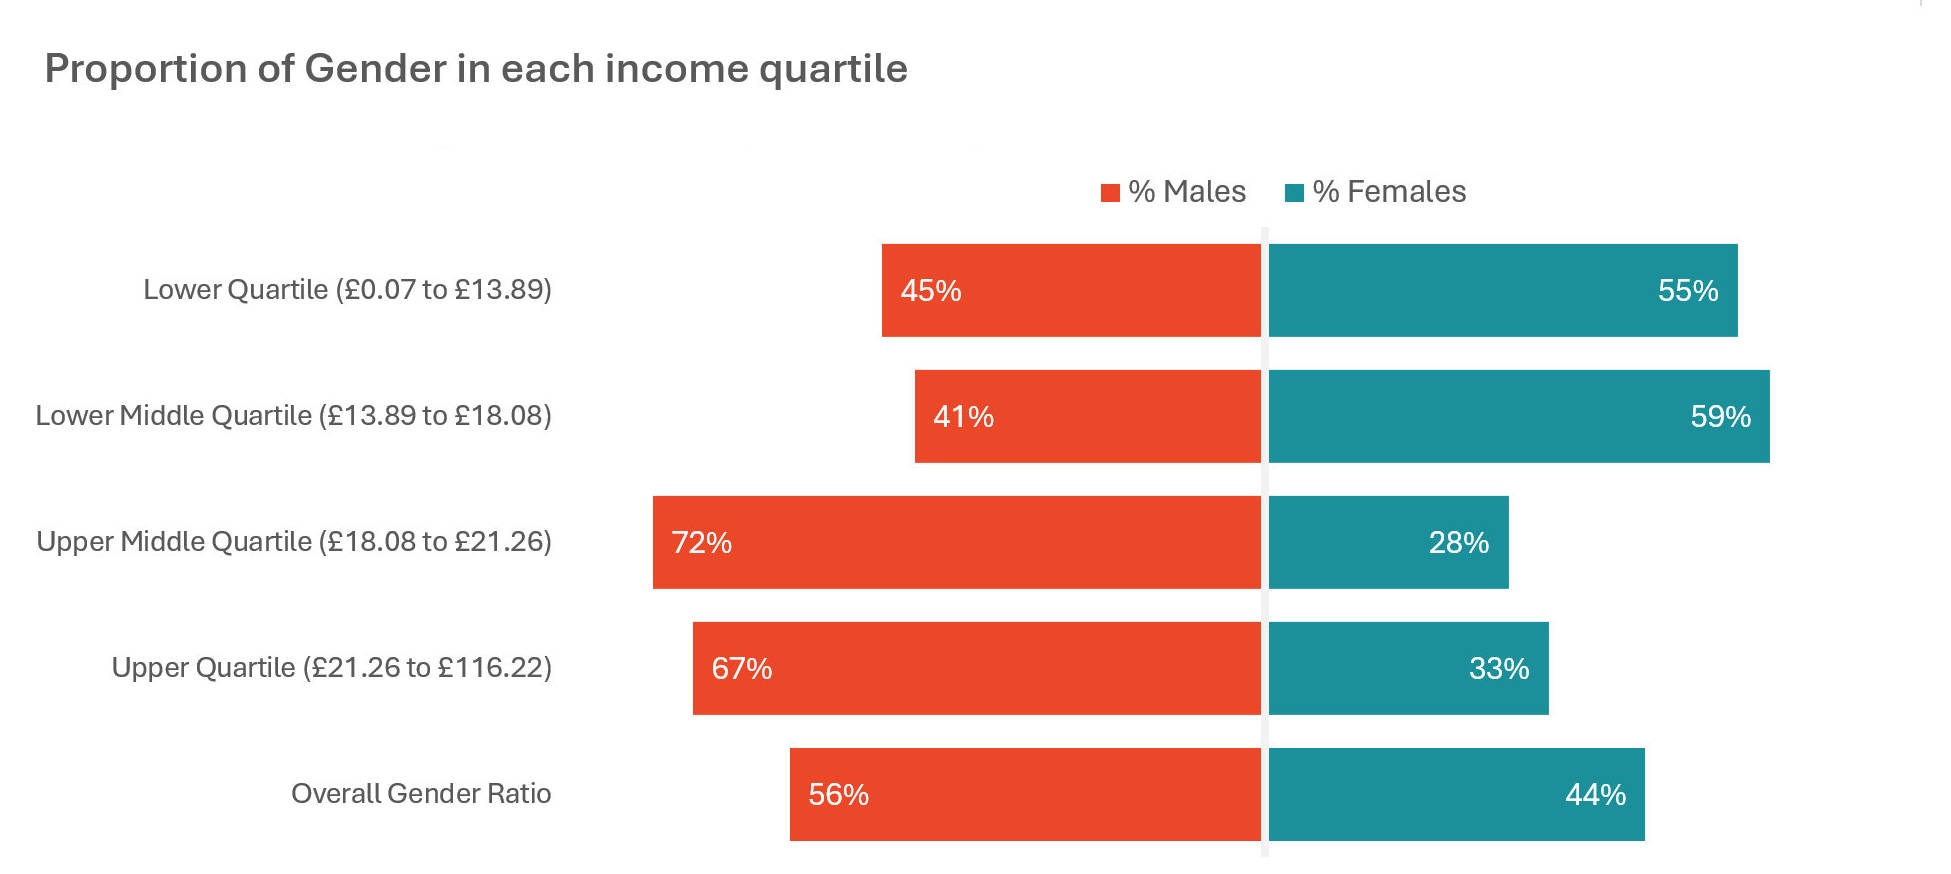
In the lower quartile, the low value of £0.07 is skewed by a responsibility payment in the form of a first aid or fire warden allowance. Women remain the majority in this quartile at 55%, driven by higher representation than men in job roles such as Business Support Assistants, Customer Service Advisor and Housing Assistants. Connexus adhered to the government standards of apprentice and National Living/Minimum Wage. During 2022, Connexus moved to paying the Real Living Wage across the organisation including apprentices in their second year. Apprentices are paid the National Living Wage irrespective of age in their first year.
The lower middle quartile has the highest representation of women across the four quartiles at 59%, compared to 41% of males. This is again driven by the higher representation of women compared to men in job roles such as Independent Living Co-ordinators and Business Support Assistants.
The upper middle quartile is the most gender imbalanced quartile, reflecting male dominance in technical and specialist trade roles, such as Heating Engineers, Electricians and Multi-Skilled Carpenters.
In finally looking at the upper quartile, female representation has decreased from 44% to 33% from 5 April 2024 to 5 April 2025, which includes fewer women in senior management roles (Head of Service or Executive level) compared to men, down from 53.8% as at 5 April 2025 to 42.8% at as 5 April 2025.
3.3 Hourly pay
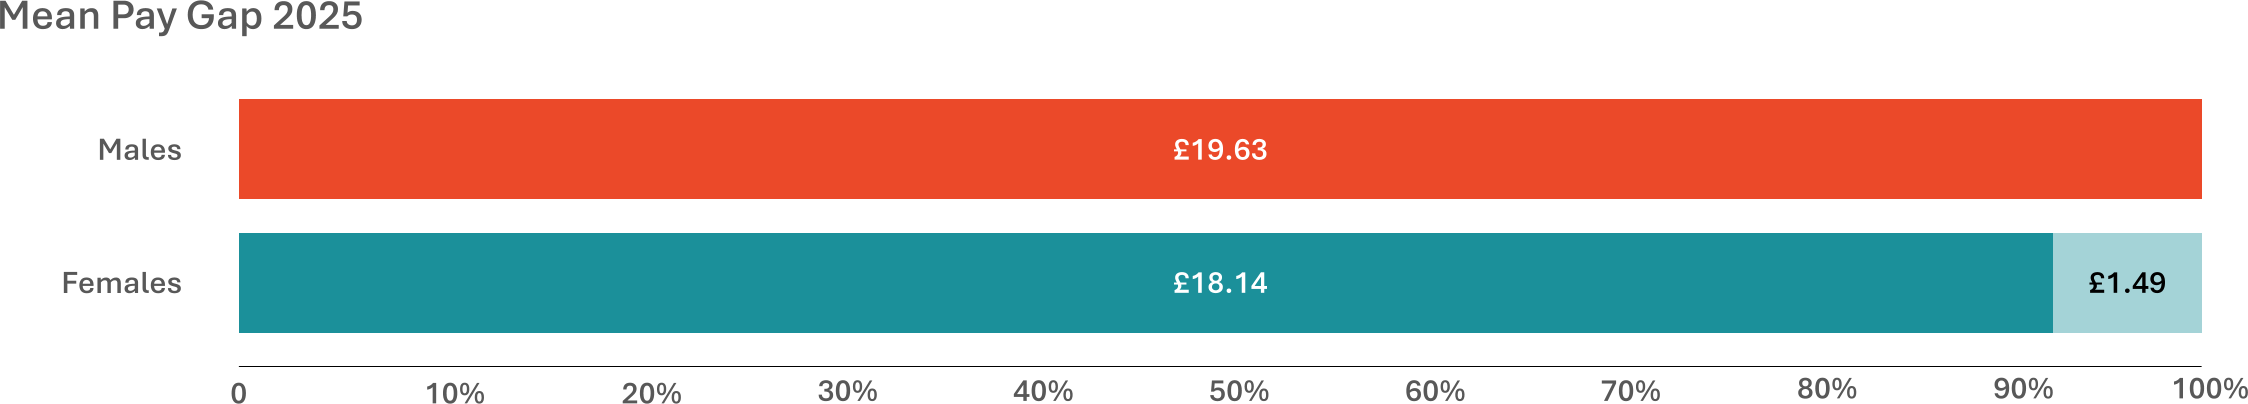
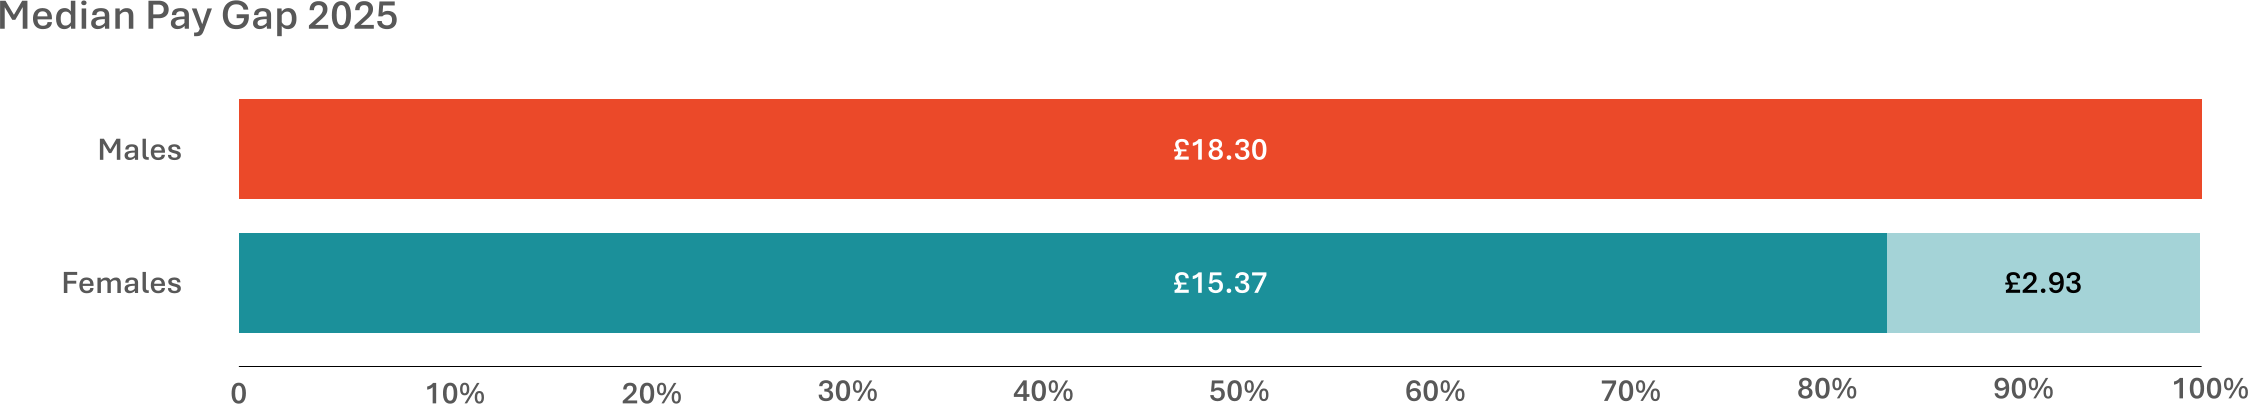
Table C below sets out the mean and median hourly pay rates across the organisation by gender as at 5 April 2025. As shown, the mean hourly rate for men is £19.63 compared with £18.14 for women, representing a mean pay gap of £1.49 per hour, or 7.60% in favour of men.
| Metric | Males (£) | Females (£) | Gap (£) | Gap (£) |
|---|---|---|---|---|
| Mean hourly pay | 19.63 | 18.14 | 1.49 | 7.60% |
| Median hourly pay | 18.30 | 15.37 | 2.93 | 16.00% |
Table C
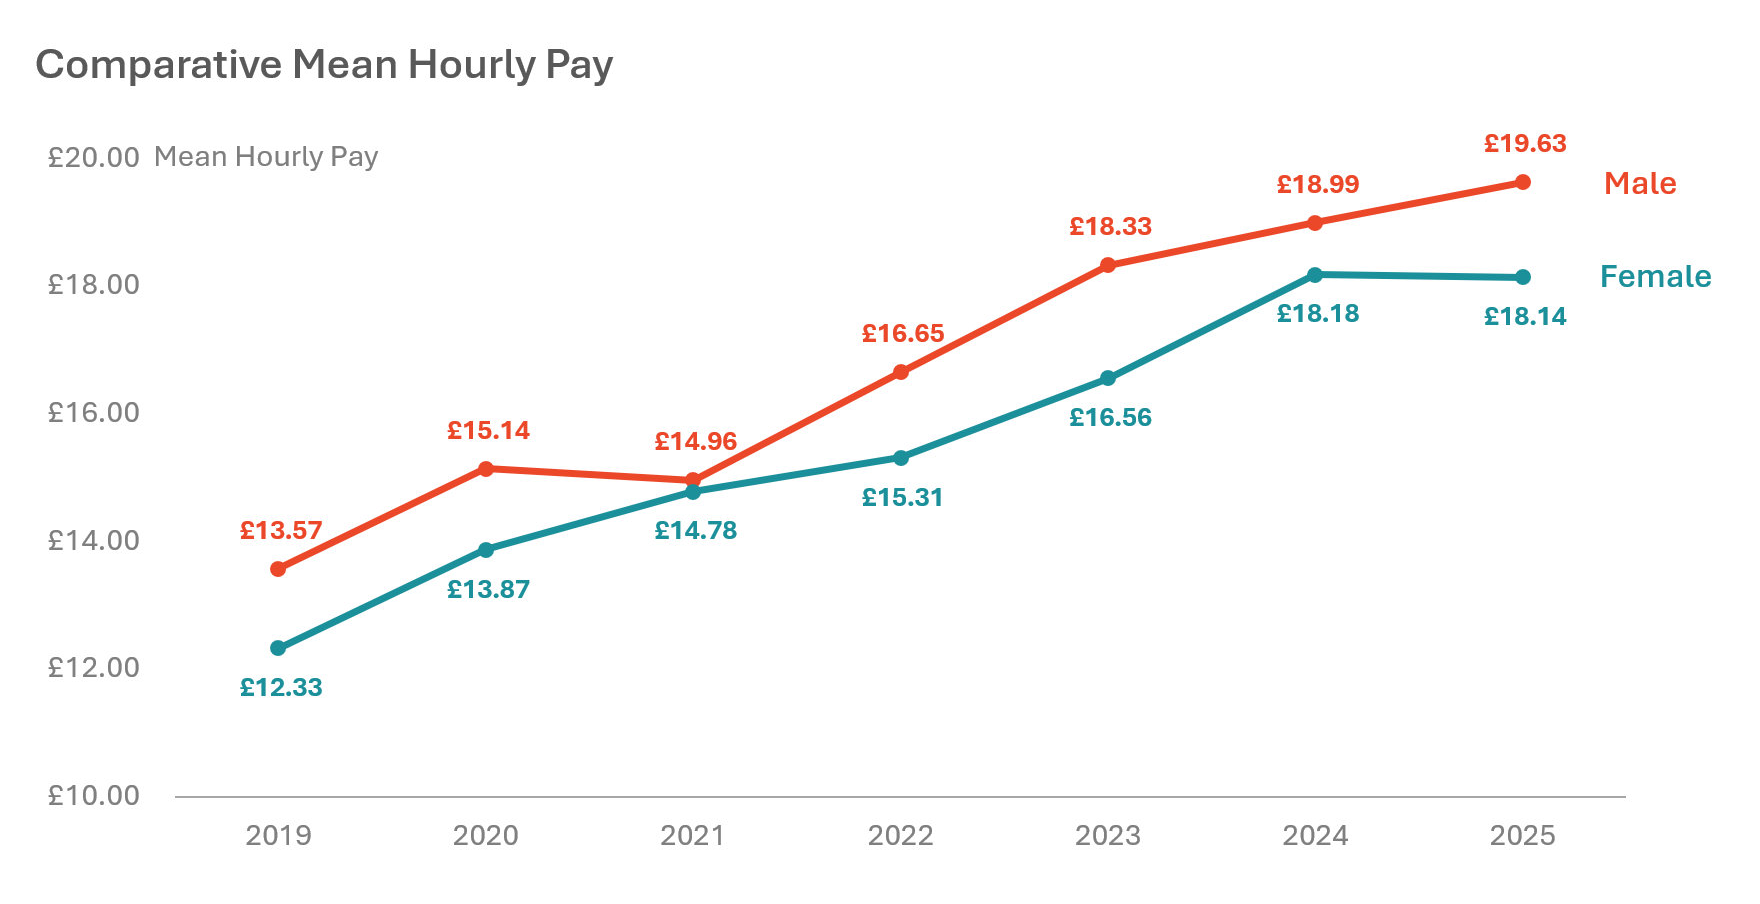
The differential is greater than in 2024, when the mean gap was £0.81 per hour (4.3%), but a lower differential than in 2023, when the mean gap stood at £1.77 per hour (9.7%). This indicates a year-on-year increase in both the cash and percentage difference, although a lower percentage and cash differential than in 2023, as illustrated in the ‘Comparative Mean Hourly Pay’ graph below.
The median (mid-point) pay gap has also widened, increasing from 13.0% in 2024 to 16.0% in 2025. At the median, men earn £18.30 per hour compared with £15.37 per hour for women, representing a difference of £2.93, up from £0.64 in the previous year.
The data also shows that median pay for men increased by £0.47 year on year (from £17.83 to £18.30), whereas median pay for women decreased slightly by £0.15 (from £15.52 to £15.37). This divergence contributes to the widening median pay gap.
The year-on-year increase in mean and median gender pay gaps are illustrated in the graph below.
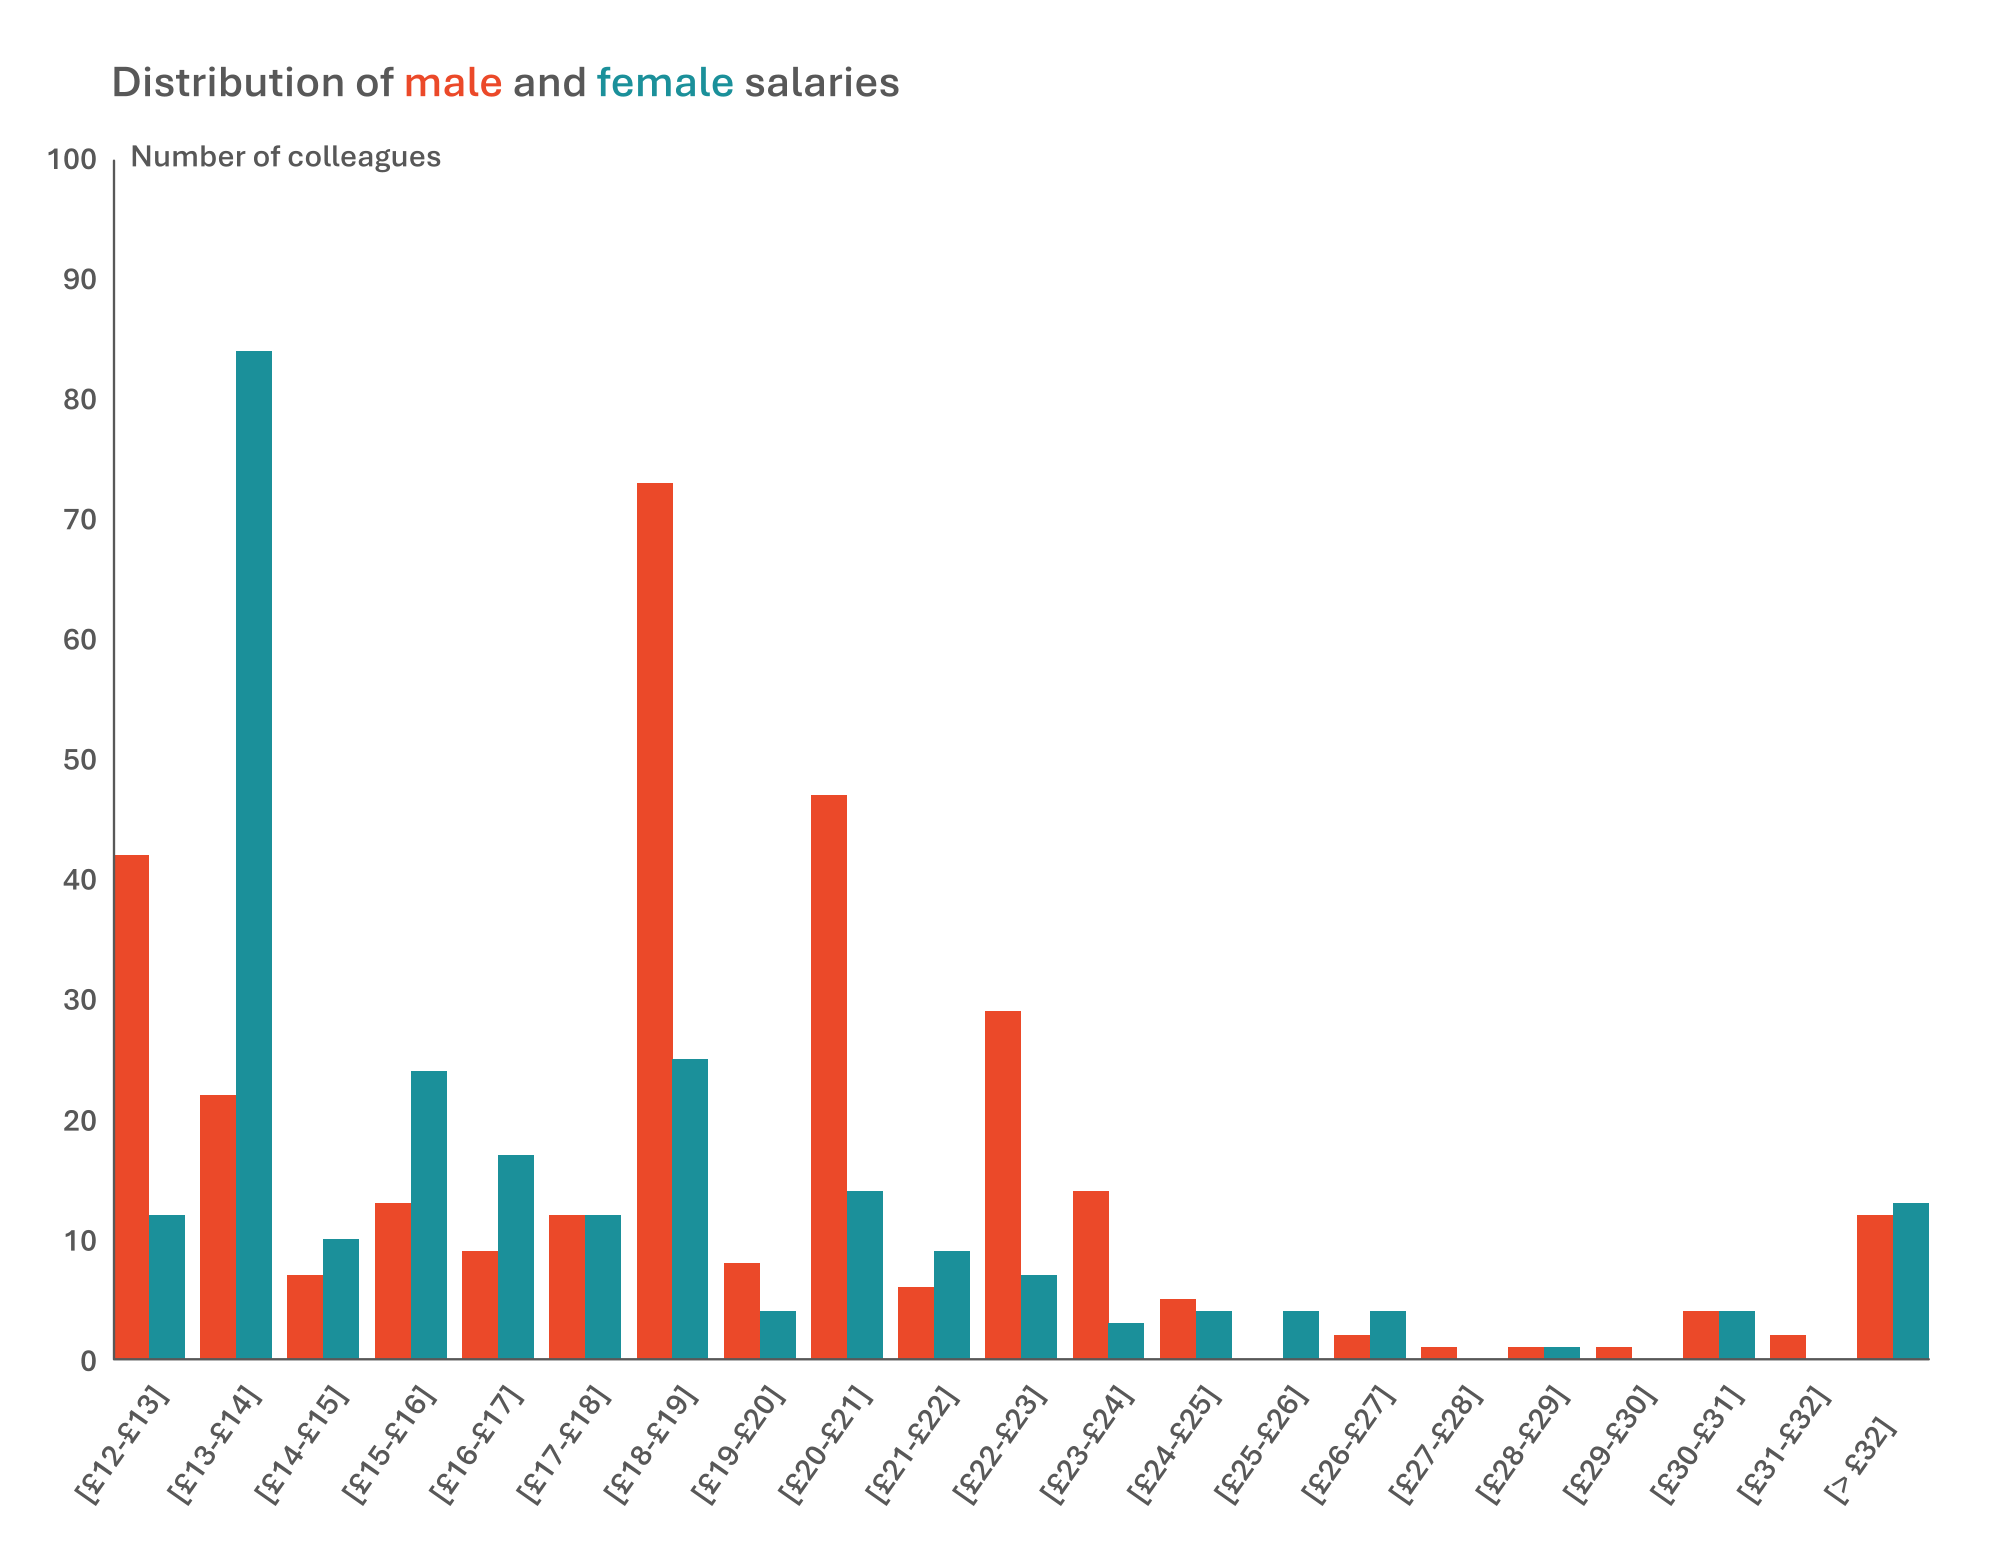
The distribution of male and female salaries across all roles within the organisation are set out in the graph below. This highlights key factors for the mean and median pay gaps, including the significant over-representation of females in the £13 to £14 hourly rate of pay category, compared to significant male over-representation in the £18 to £19 and £20 to £21 hourly rate categories.
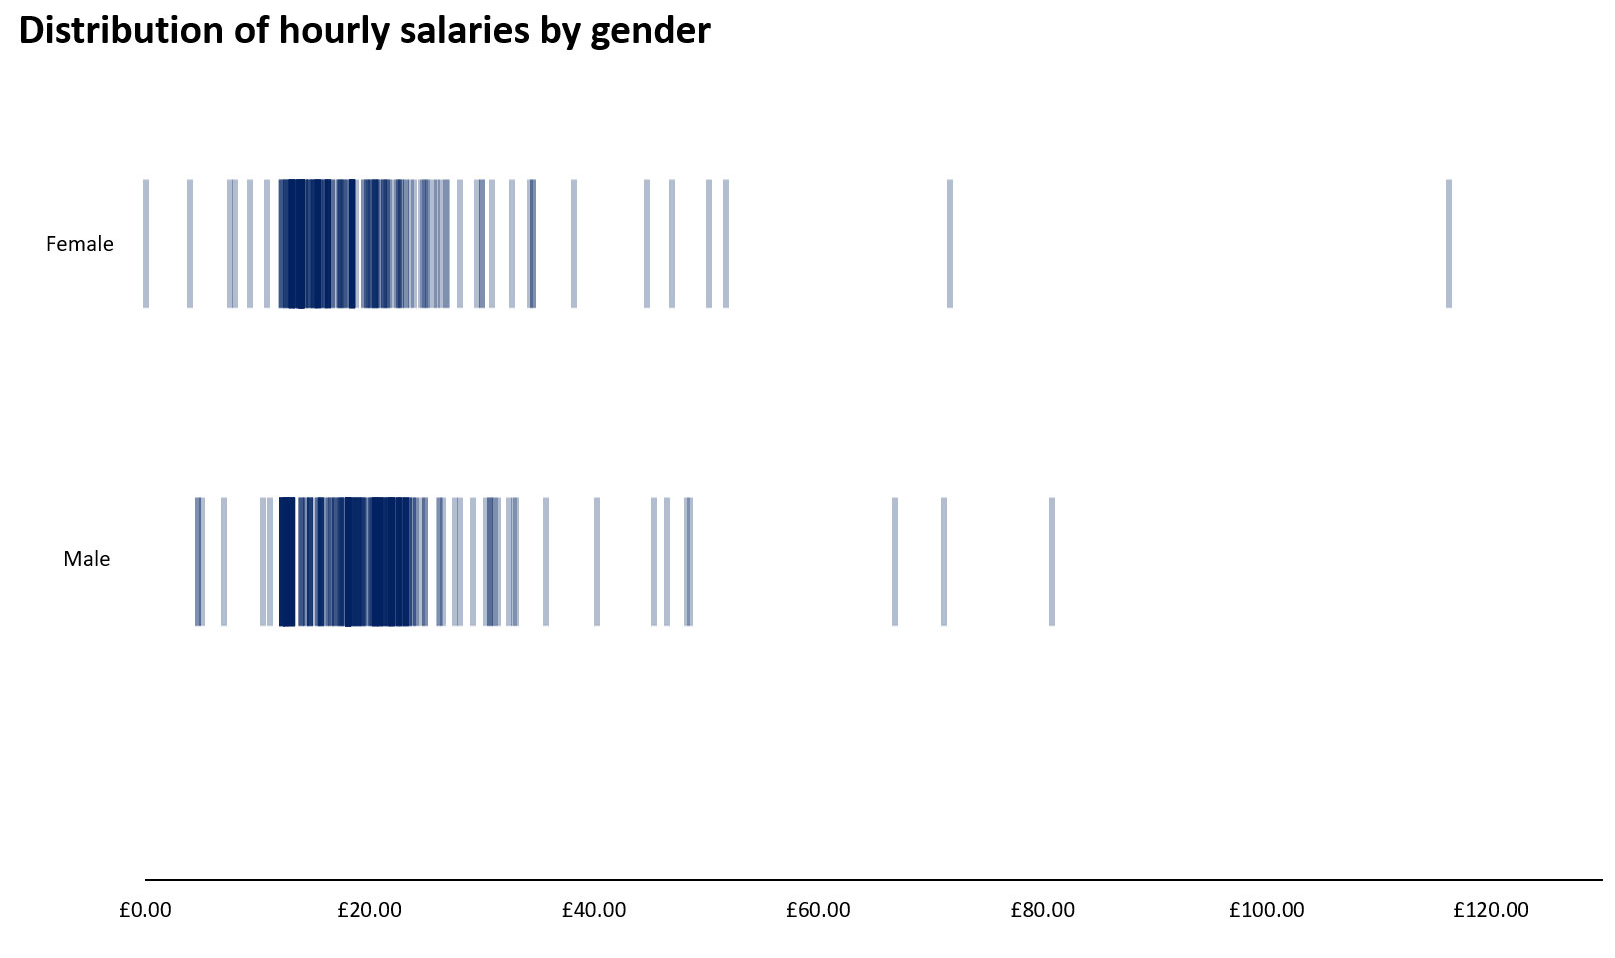
The ‘Distribution of hourly salaries by gender’ chart above offers a comprehensive perspective on salary patterns, revealing clusters, outliers, and the full salary range across the organisation’s varied roles.
4. Drivers behind this year's gender pay gap
Occupational representation
As previously stated, the reduction of women compared to men within the Upper quartile (down from 53.8% as at 5 April 2024 to 42.8% at as 5 April 2025) including the reduction of female directors from 3 to 2 within the 12-month comparison period, has negatively impacted the gender pay gap.
Higher paid operational roles such as skilled trades (e.g. electricians, carpenters and plumbers) which often command a wage premium with a national skills shortage, also remain male dominated within the organisation, as well as being a wider societal issue, with just 2% female representation across the UK.
Women are more concentrated in lower and lower middle quartiles at 55% (lower quartile) and 59% (lower middle quartile), with an increasingly uneven distribution of males to females within the upper middle and upper quartiles at 28% and 33% female representation respectively.
Progression Pathways
The gender ratios within the quartiles shows that women enter roles in higher numbers within the lower quartiles relative to men, but progress at lower rates into technical or leadership roles within the upper quartiles, highlighting the requirement for stronger career pathways and leadership development programmes considering opportunities for all, as set out within the People and Equality, Diversity and Inclusion strategies.
5. Ethnicity Pay Gap
5.1 Mean & median Ethnicity Pay Gap – year-on-year comparison
| Snapshot Year | Mean EPG | Median EPG |
|---|---|---|
| 2023–2024 | -7.8% | -1.8% |
| 2024–2025 | -7.6% | 3.0% |
Table D
The mean EPG decreased slightly from -7.8% to -7.6%, representing a 0.2% reduction in what is still a favourable pay gap compared to white colleagues, due to the highest representation of colleagues from ethnically diverse backgrounds being in the upper quartile as set out below in 5.3.
The median EPG increased from -1.8% to 3.0%, representing a decline of 4.8% from a favourable to an adverse median (average point) pay differential, due in part to the second and third highest representation groups of colleagues from ethnically diverse backgrounds being in the lower and lower middle quartiles as set out below in 5.3.
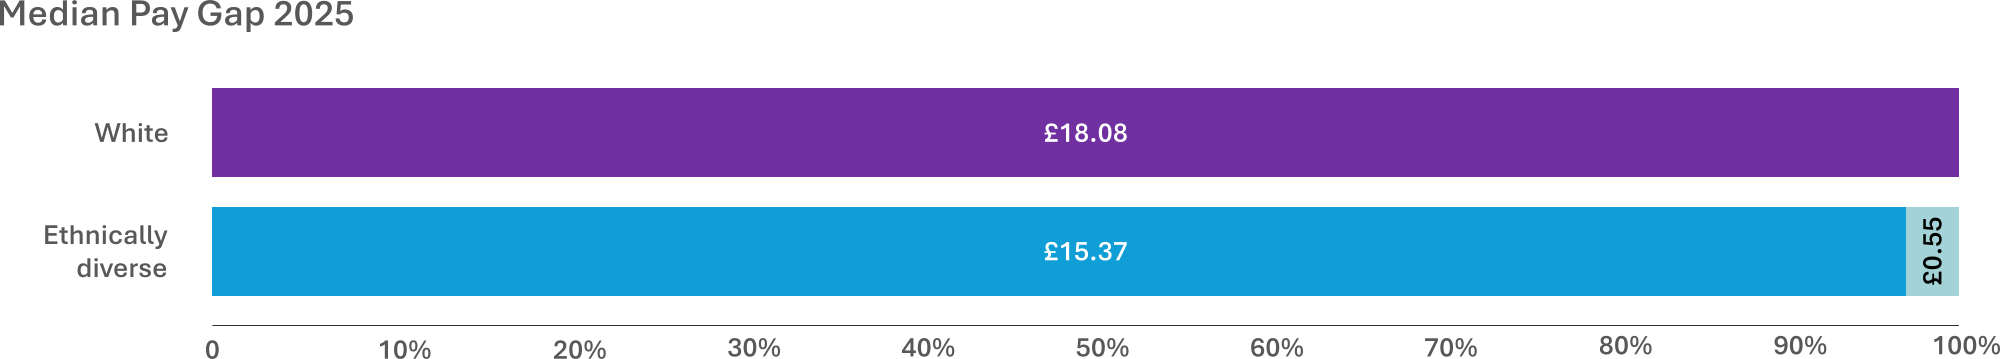
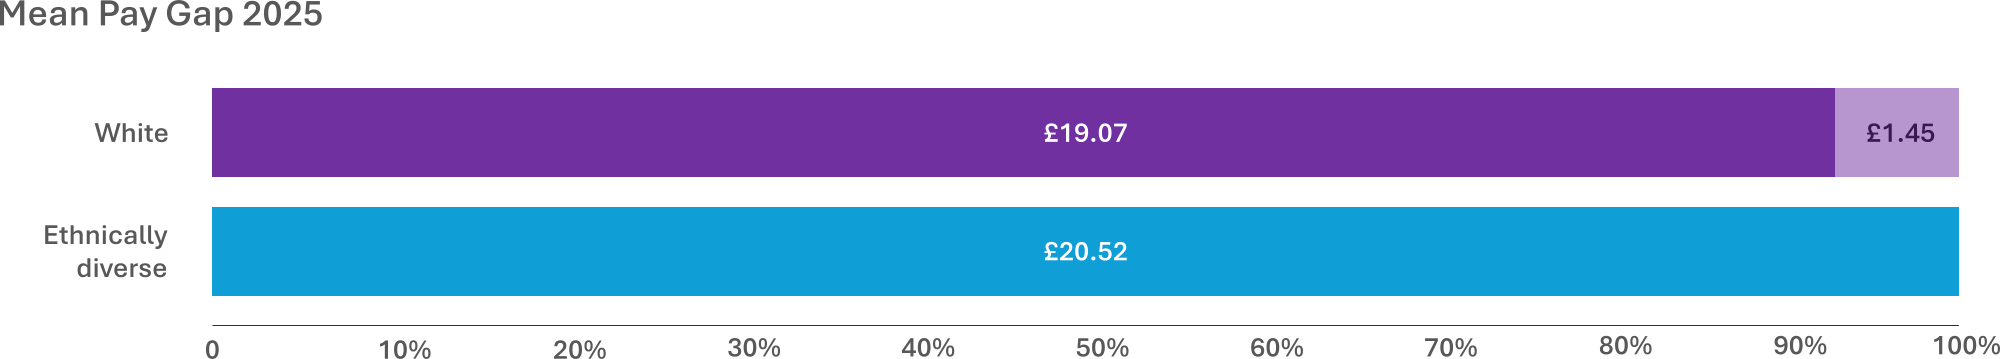
The Ethnicity Pay Gap therefore highlights a divergent trend in 2025, whereby the mean pay gap for ethnically diverse colleagues has remained higher than white colleagues at -7.6% (£1.45), and the median pay gap has dropped below white colleagues at 3.0% (-£0.55).
5.2 Ethnicity Pay Gap (2025) – Summary
| Metric | Ethnically Diverse (£) | Ethnically Diverse (£) | Gap (£) | Gap (%) |
|---|---|---|---|---|
| Mean hourly pay | 20.52 | 19.07 | £1.45 | -7.6% |
| Median hourly pay | 18.08 | 17.53 | -£0.55 | 3.0% |
Table E
5.3 Ethnicity quartiles
| Quartile | Pay Range (£) | % White | % Ethnically Diverse | % who did not declare / preferred not to say |
|---|---|---|---|---|
| Lower | 0.07–13.96 | 79.7% | 1.7% | 18.6% |
| Lower Middle | 13.96–18.08 | 71.3% | 3.4% | 25.3% |
| Upper Middle | 18.08–20.92 | 91.1% | 0.9% | 8.0% |
| Upper | 20.92–116.22 | 86.1% | 3.5% | 10.4% |
Table F
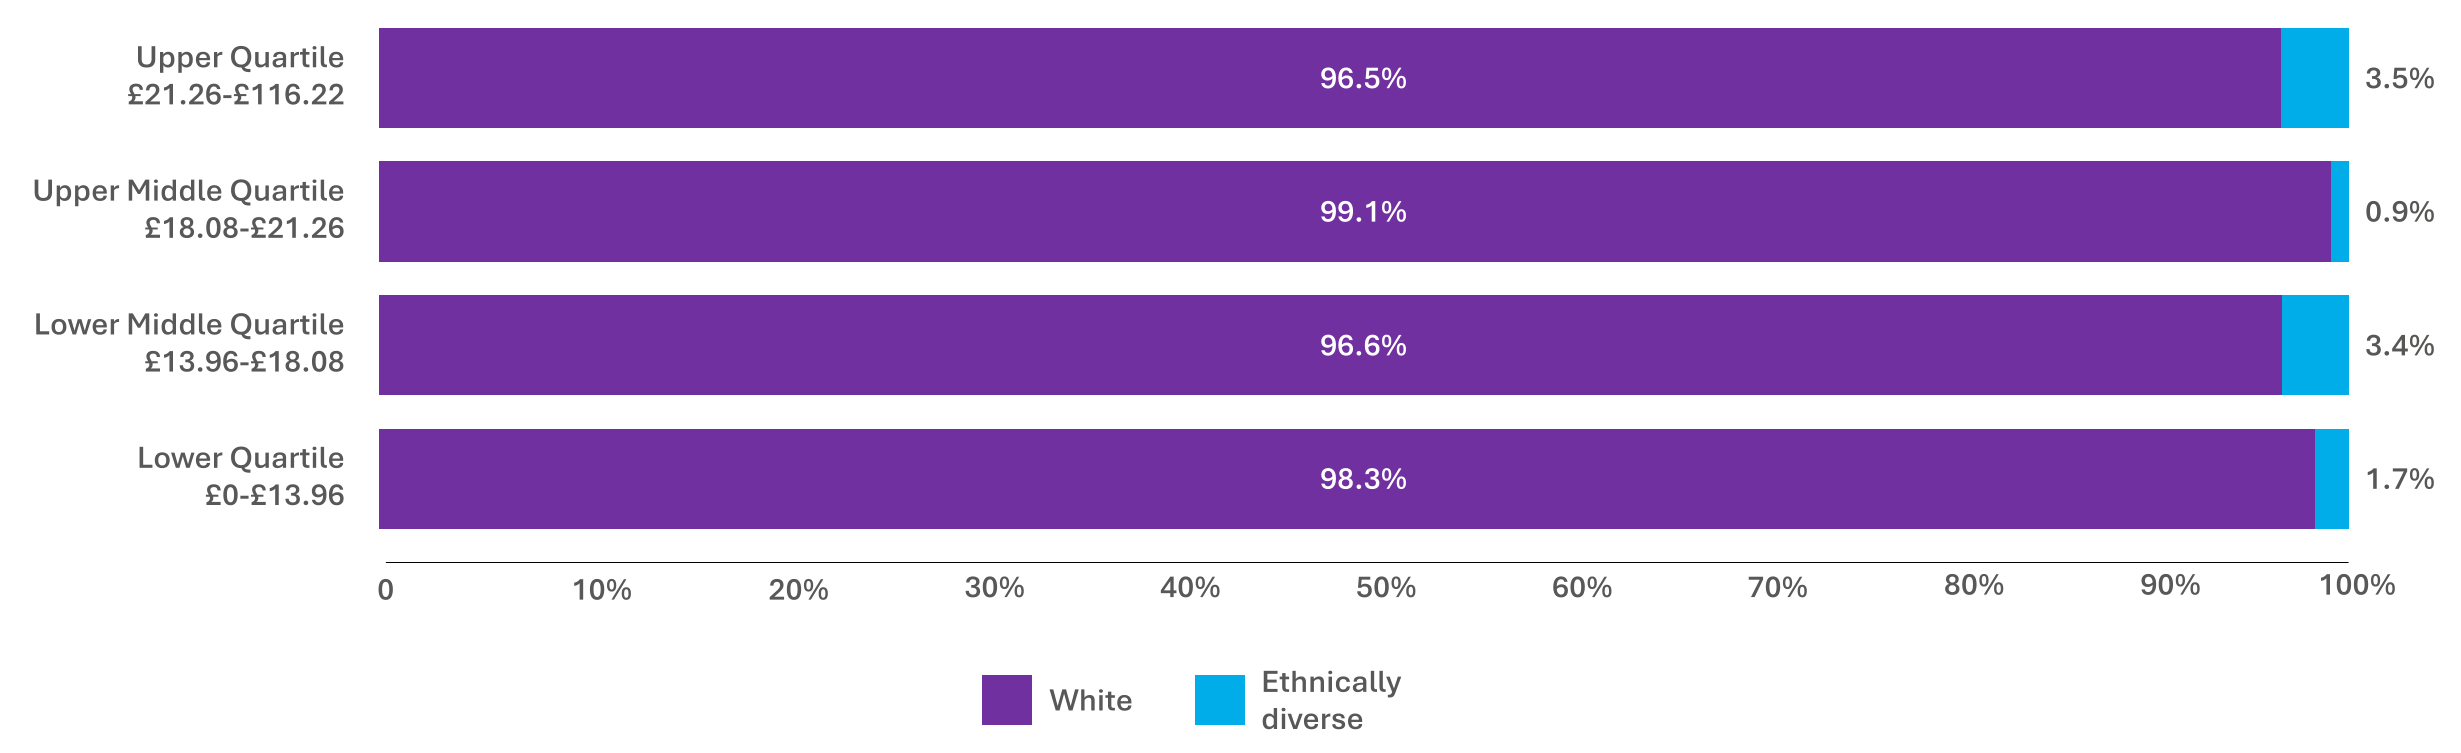
5.4 Ethnicity quartile evaluation
Ethnic diversity is strongest in the upper quartile at 3.5%, with the highest number of colleagues from ethnically diverse backgrounds, up from 1.9% in 2024, representing a 1.6% increase. This is closely followed by the lower middle quartile at 3.4%, up from 1.9% in 2024, representing a 1.5% increase.
Representation of colleagues from ethnically diverse communities drops sharply in the upper middle quartile at 0.9% compared to the highest percentage of white colleagues in this quartile at 91.1%, indicating a potential progression and succession pinch point into senior roles from a diversity and equality perspective.
There is a low number of colleagues from ethnically diverse backgrounds entering the organisation within the lower quartile at 1.7%, which includes customer facing roles such as Customer Service Advisors and Housing Assistants in providing first point of contact help and advice to our diverse customer base across Shropshire and Herefordshire.
Each of the quartiles indicates a gap in ethnicity data ranging from 8.00% and 25.3%, whereby colleagues either did not declare or preferred not to declare their ethnic background, which the EDI Strategy aims to address through improved data capture of protected characteristics. A recent review of the local Census data in developing the EDI Strategy highlighted that 1.9% of Connexus colleague identify as being from ethnically diverse communities compared to 3.23% of people across Shropshire and Herefordshire, in highlighting a diversity workforce gap and opportunity in becoming more representative of the communities Connexus serves.
6. Actions to address Gender & Ethnicity Pay Gaps
The organisation continues to strengthen its approach to equality, diversity and inclusion through a number of key workstreams through the EDI Strategy. As set out in Section 5, a major focus remains on data-driven accountability, with ongoing efforts to improve the capture of protected characteristic information including ethnicity, disability and sexuality. This work is supported by visible commitment to equality and clear communication around the EDI strategy, ensuring colleagues understand why this data matters and how it will be used. Alongside this, we are developing more robust ways of tracking internal progression for underrepresented groups and exploring targeted initiatives such as reciprocal mentoring and tailored skills-development programmes.
Progress also continues in enhancing inclusive engagement across the workforce. We are actively working to improve diversity within skilled trades apprenticeships, demonstrated by the strong September 2025 intake, which included 40% female representation. The development of lived-experience colleague networks is another important strand, providing spaces for connection, insight and advocacy. At the same time, we are increasing the visibility of diverse role models across the organisation to challenge entrenched stereotypes and shift perceptions both internally and externally.
Embedding inclusion within our culture and systems remains central to this work. As part of the wider People Strategy Pay and Benefits programme, we continue to maintain consistent pay frameworks aligned to external benchmarks. Alongside this, we are committed to ensuring inclusive recruitment practices, such as embedding diverse shortlisting and recruiter training in ensuring fair and transparent processes are consistently applied. Work is also underway to integrate EDI considerations into performance and succession planning processes so that equity becomes an integral and expected component of how talent is supported and developed.
Our leadership team is committed to reinforcing the behaviours and practices that foster an inclusive workplace. We will continue to monitor colleague feedback through the engagement survey and use the insights to identify opportunities and develop targeted actions for improvement. We are supporting managers to adopt fair, consistent feedback models, and we are strengthening expectations around inclusive leadership through the skills and behaviours framework. Together, this work ensures that leaders at every level help build a culture where all colleagues feel valued, supported, and able to thrive.